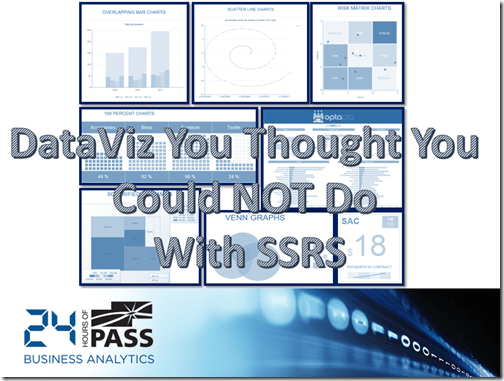
It’s been almost 3 months since I blogged and this has been the longest time I have been away from this space since I started blogging. There are a couple of reasons behind it (which included the suspension of my blog by Google for allegedly hosting malicious code!!!) but more on this later. For now I just wanted to post the download link for the demos used in my 24 Hours of PASS session - DataViz You Thought You Could NOT Do with SSRS.  The report solution files are available for download here. The rdl files for the 8 reports that I showed as well as the shared data sources are present in the zip file. You can run the reports by pointing the shared data sources to your local database for most reports. However, the following reports will not run as additional information or data is required – Squarified Tree Map.rdl and MCFC.rdl. However, you can learn more about these two charts by visiting my earlier blogs on Heat Maps for SSRS using Map Control and Linking and Brushing Visualization with SSRS. This was a sneak peak of my session that I am presenting at the PASS BA Conference. For people who are wondering what this is all about - On February 5, BA and BI community experts presented a series of 1-hour webcasts delivering best practices and expert tips for getting the most from your data. This 24 Hours of PASS event provided a sneak peek at what you can expect at the PASS Business Analytics Conference May 7-9 in San Jose, CA. Sign up today and you can use my discount code BASF2A to save $150 off the registration price. The 24 Hours of PASS session recordings (which includes my session also) are now available for streaming. Access the recordings for free now.
My Sessions
I am speaking at…
And so, it has been an eventful 3 months since I reached the US, and I must say I am really settling in well to my new job and life here. Also, it has been a full two years since I started blogging and a big shout to all those lovely people out there who have been tolerating me and my “random thoughts”. I decided that it is time to start meeting all those great guys around me and what better way than to come and speak at an event near you?  So just as an FYI, I would like to let you know that I am speaking at the following events :- 1) Charlotte SQL Server User Group : Thursday, April 19, 2012 from 5:30 PM to 7:30 PM http://apr2012cssug.eventbrite.com/ 2) SQL Saturday 118 (Madison, WI) : Saturday, April 21, 2012 from 9:30 AM to 10:30 AM http://www.sqlsaturday.com/118/schedule.aspx 3) SQL Saturday 130 (Jacksonville, FL) : Saturday, April 28, 2012 from 3:45 PM to 4:45 PM http://www.sqlsaturday.com/130/schedule.aspx 4) SQL Saturday 129 (Rochester, NY) : Saturday, May 12, 2012 from 10:15 AM to 11:15 AM http://www.sqlsaturday.com/129/schedule.aspx Don’t forget to come and talk to me if you are attending any of these events, nothing makes me more happy than getting to know my readers better. Well, actually I am lying, a mug of beer makes me happier. But then there is no reason why we can’t have a talk over a beer, right?
Fast Track to Spatial Reporting - SQLBits session material for download
So one more objective struck off from my annual list. Even though I had nightmares where my laptop crashed just before my session, nothing untoward happened and I managed to complete my first session at SQLBits without any problems. The session was scheduled on Oct 1 at 8.10 am in the morning (at a time when I would normally be snoring in my bed). There was a brief moment of confusion when I discovered around 7.30 am that my laptop did not have the VGA port for plugging in the projector (the new DELL systems just have the HDMI and mini USB ports). Luckily, James Boother (twitter | blog) and Neil Hambly (twitter | blog) helped me get a converter and salvaged the situation. I was able to complete all the demos within the stipulated 1 hour time though I thought I had to race at some parts. Anyways, I will be blogging about my overall SQLBits 9 experience in detail soon. Till then, feel free to download the materials that I used in my session below:-
- Session slides – contains the PowerPoint presentation (2 MB)
- Report RDLs – contains all the report files used in the demo (12 MB)
- Database backup – contains the spatial database used for the reports (41 MB)
- Demo notes – short notes describing the demo (5 KB)
And here I announce the good news…
To all my loving and caring readers who had been wondering where the hell did I get lost the last month, I have two good news for you. 1) I got hitched! Yes, I had been on a vacation last month and meanwhile managed to upgrade the status of Ms Neethu Sebastian from long-time girlfriend to wifey . The wedding was a lot of fun but hectic to the core (roughly translates to – enjoyed it but never doing it again). 2) My session got selected for SQLBits 9! Yes, I will be speaking at SQLBits 9 – Query across the Mersey. Just got the confirmation from the SQLBits team that my session – Fast Track to Spatial Reporting has been selected. The session would be held on Oct 1, Saturday from 8.10 to 9.10 am. Please click on the agenda below for more details. P.S. : If you are attending SQLBits 9 in Liverpool, make sure that you drop in and say a hi to me
SSAS Best Practices–Session slides for download
Looks like I am on a session taking spree, this was my third one in 3 weeks. This time, I decided to collate some of the best practices in SQL Server Analysis Services and present it for the BI minds in my company, MindTree Ltd. This is one subject that just doesn’t finish in 1 hour, and even though I tried to cut down a lot of points, I ended up spilling by almost 15 minutes. A big thanks to Emil Xavier for organizing the session and for arranging the logistics, everything was prim and proper. Anyways, without boring you guys further, here goes the session slides. Feel free to pass it around!
Let’s Go Spatial – Session slides for download
So that’s one objective struck off from my list for this year. Yes, I made a presentation on the mapping features in SSRS 2008 R2 for the London BI User Group on 21 June, 2010. The UG meeting was held in the Hitachi office near London Bridge and was attended by around 30 people. A big thanks to Hitachi Consulting for sponsoring the beer / pizza and of course, for allowing us to use their office for the meeting. Another round of applause to Chris Webb (blog) for organizing this UG meeting and personally, my gratitude for giving me the opportunity to speak. Though my presentation was more focussed on demos, I am attaching the slides that I used for my session – ‘Let’s go Spatial’ along with this post. I will try to upload the rdls of the reports also but that might take some time. So keep checking or ping me if you have got some urgent need for the sample reports used in my presentation.  The demos included
-
Creating map reports from ESRI shapefiles
-
How to deal with deployment errors with large shapefiles
-
-
Creating map reports from Spatial Data
- How to import shapefiles into your database
- Visualizing your map reports using measures
- How to drill up and down your map reports
- How to do custom aggregation in your map reports
- Creating bubble maps in your map reports
This was followed by an amazing session on Change Data Capture by the charismatic Duncan Sutcliffe (blog | twitter). Overall a nice day and looking forward for more BI user group meetings.

