SSAS

Performance Problems with IF statement execution in SSAS Tabular

Due to the high compression rates and stellar in-memory architecture of SSAS Tabular, most people with smaller models do not experience performance problems (in-spite of employing bad data modeling techniques and inefficient DAX measures). However, as the size of your models increase, you will start to see performance issues creep up, especially if you are not paying attention to data modeling and DAX measures. Last week, I gave a presentation at the PASS Summit 2015 on my experience of building a 150 GB Tabular model in SSAS 2012. During that, I shared my story on how some of the DAX measures with IF statements were causing performance issues and how to work-around that issue by rewriting your DAX measures. During that day, Microsoft also announced that they resolved this issue in SQL 2016, so I thought of demonstrating the issue, workaround and also the fix in SSAS 2016.

Issue in SSAS 2014 (& older versions)

For demonstrating the issue, I will be writing queries against the Adventure Works model in SSAS 2014 and using MDX Studio to show the server timings. Let me start with the below query

WITH MEASURE ‘Date'[test] = If ( 1 = 2, [Internet Total Sales], [Reseller Total Sales] )
SELECT NON EMPTY { [MEASURES].[Test] } ON COLUMNS,
NON EMPTY (
{ [Date].[Calendar Year].Children },
{ [Product].[Product ID].Children },
{ Geography.[Country Region Name].Children } ) ON ROWS
FROM [Model]

The above MDX query defines a DAX measure called Test, which depending on the condition displays either Internet Total Sales or the Reseller Total Sales (To make it simple, I just made a static condition 1=2 but that can be replaced by any dynamic condition also). The query results should display the Test measure for Year, Product ID and Country. Now, normally we would expect that the Test measure should only execute the true part of the IF statement. But let us execute this in MDX Studio and see what actually happens.

You can see that both the branches of the IF statement are being executed, even though we expect only the true part to be executed. For smaller models, it might not make a difference but for large models with expensive measures, this might cause severe performance issues.

Workaround in SSAS 2014 (& older versions)

The workaround for this issue is to rewrite your DAX such that we ensure that the measures get executed only if the condition is true.

WITH MEASURE ‘Date'[test] = CALCULATE([Internet Total Sales], FILTER(Currency, 1=2)) + CALCULATE( [Reseller Total Sales], FILTER(Currency, 1<>2))
SELECT NON EMPTY{[MEASURES].[Test]} ON COLUMNS,
NON EMPTY({[Date].[Calendar Year].children}, {[Product].[Product ID].children},{Geography.[Country Region Name].children}) ON ROWS
FROM [Model]

Note that the measure has been rewritten as the sum of two CALCULATE functions. The key is to use a table in the filter clause within the CALCULATE that satisfies the below conditions

  • Is related to the fact table of the measure
  • Is low in cardinality (you can also use a low cardinality column instead of a table)
  • Is not being used in the calculations for the measure/condition. If yes, do some extra testing to make sure the performance is not worse

The reasoning behind the table being connected to fact table is because the calculate() with the false condition has to evaluate to zero / BLANK so that the result of the Test measure would only be the one appropriate measure. If the table is not related, you will end up with the sum of both the measures. A low cardinality table or column is preferred because in this technique, you will see that there are 2 additional queries being sent to the storage engine, which evaluates the FILTER part for the two measures. If the tables have high cardinality, the time for the FILTER queries will take more time. The reason why I said that the table or column should not be used in the measure calculations or condition is because I have seen that in certain conditions, this could actually make the performance worse and still execute both the branches. So just make sure you do some extra testing.

That said, let us look at the scans for the above query. You can see that only the Reseller Sales measure is executed. Also, if you notice carefully, there are 2 extra scans which basically check the filter condition for Currency. In large models, these scans for low cardinality dimensions will be almost negligible and the time for these extra scans will be much lesser than the time taken to execute the other measure also. In this case, the Adventure Works model is just 18 MB, so you won’t see much of a difference.

New Optimization in SSAS 2016

SSAS 2016 CTP2.3 (and newer versions) has a new optimization for this issue – Strict evaluation of IF / SWITCH statements. A branch whose condition is false will no longer result in storage engine queries. Previously, branches were eagerly evaluated but results discarded later on. To prove this, let us execute the original query against SSAS 2016 and see the results.

Now we can see only the relevant measure is being executed. Also, it is faster compared to SSAS 2014 versions of both the original query as well as the workaround. I hope this article will help people who are not on SSAS 2016 to optimize IF statements, and also help understand what the new optimization in SSAS 2016 – Strict evaluation of IF / SWITCH statements actually means. There are also a bunch of new features and optimizations in SSAS 2016 and you should check them out!

Posted by SQLJason, 2 comments

My Thoughts on Calculated Tables in Power BI

Yesterday was a terrific day for all of Microsoft Power BI fans. Microsoft released updates for Power BI Service, Power BI Mobile and Power BI Desktop (with an unbelievable 44 new features) – which basically means no matter whether you are a developer, BI professional or an end user, all of you got something new to play with along with this release. The blogs give a lot of details on what those new features are, so I wouldn’t be going over them. But I wanted to take a moment to pen down a few moments on my thoughts on a new modeling feature within this release - Calculated Tables.

Chris Webb has already posted his thoughts on Calculated Tables in Power BI and I am pretty sure Marco Russo / Alberto Ferrari will post some on the same pretty soon (if not, this is an open request from my side for Marco & Alberto to post something on the topic, pretty please ) – [Update 9/28/2015 Read Transition Matrix using Calculated Tables]. As usual, a combination of posts from these folks are going to be the best resource for any topic in the Modeling side, and I learn most of my stuff from them. So you would be thinking – what exactly am I trying to achieve in this post? Well, I would like to add my 2 cents on the same and try to see if the community in general agrees with what I think and if not, to learn from the comments and the interaction this might generate.

I) How to build Calculated Tables in Power BI

Before I start on my thoughts on calculated tables, it might be a good idea to quickly see how we can create calculated tables.

1) First make sure that the version of Power BI is equal to or higher than 2.27.4163.351. (I am making a fair assumption that this feature will be enabled in all higher versions also released in the future). If not, download it from here

2) Now open any of your existing models in Power BI (or get some new data), and after that, click on the Data tab. You should be able to see the New Table icon in the Modeling tab on the top.

3) Click on the New Table icon, and then enter any DAX expression in the format that returns a table TableName = DAX Expression that returns a table Once you do that, then you should be able to see the resultant columns in the new table.

II) When is the data in a Calculated Table processed

The official blog says quite a few things on the same-

    • A Calculated Table is like a Calculated Column.
    • It is calculated from other tables and columns already in the model and takes up space in the model just like a calculated column.
    • Calculated Tables are re-calculated when the model is re-processed.

So based on this information, I am going to go a step further and assume that the data in a calculated table is processed during the ProcessRecalc phase of processing. Also, this means that every time any of the source tables changes (like a new calculated column or new data), the data in the calculated table will also change. To prove this, let us try a simple experiment-

1) Make a calculated table called Test which will be the same as the Date table (which currently has just the Year column).

Note that measures from the source table are not brought along to the calculated table, which is as expected.

2) Now go to the Date table (which is our source table in this case) and then add a new calculated column called TestColumn with 1 as the value.

Note that when we added a calculated column in the source table, the column was replicated in the calculated Table also with the same name. The only difference is that the source table shows an icon for calculated column. This shows that the ProcessRecalc that happens in the source table when a new calculated column is made, also recalculates the calculated table.

III) My thoughts on Calculated Tables

Based on my understanding so far, there are times when I think I should use calculated tables and times when I should not use calculated tables. So here it goes -

a) When NOT to use calculated tables

If you have a way of replicating the calculated table in some form of ETL or source query (even a SQL View), you should not use a Calculated table. Why? A couple of reasons

  • If done from ETL / source query, the engine will see the result as a regular table, which means parallel processing of the tables can be done (unlike now, where the ProcessData phase of the source tables have to finish first before the calculated tables can be processed). So calculated tables could lead to slower data processing time.
  • A ProcessRecalc happens every time you do a process full, and adding more calculated tables (as well as calculated columns) unnecessarily will increase the processing time. Also, during development of very large models, you might have to wait for a long time after each calculation is made for the data to appear, since all dependent tables will also have to be recalculated (unless you turn off the automatic calculation mode).
  • This one is more an assumption and further research will be needed to validate this, but I am putting it forward anyways. Just like a calculated column is not that optimized for data storage compared to a regular column, I suspect that a calculated table will also not be optimized for storage compared to a regular table. If this is true, this might affect query performance.

b) When to use calculated tables

There are a lot of scenarios where you would want to use calculated tables and I have listed a few of the scenarios below

  • During debugging complex DAX expressions, it might be easier for us to store the intermediate results in a calculated table and see whether the expressions ate behaving as expected.
  • In a lot of self-service BI scenarios or Prototype scenarios, it is more important to get the results out there faster and hence, it might be difficult or not worth the effort to fiddle with the source queries. Calculated tables can be a quick and easy method to get the desired table structures.
  • A kind of scenario that I see very often during prototyping / PoCs is when there are 2 facts in an excel file which are given for making reports. As seasoned users of Power Pivot / Power BI, we know that we will have to create a proper data model with the dimensions. Now, I might need to create a dimension which gets me the unique values from both the tables. For eg, in the below example, I need the Country dimension to get values from both the tables (USA, Canada, Mexico). It might be easier to write an expression for a calculated table like shown below
    Country = DISTINCT(UNION(DISTINCT(Table1[Country]), DISTINCT(Table2[Country])))

  • There are times (like in some role playing dimensions) where you will need to replicate the columns / calculated columns (or even delete) in another table also, even if the columns are built at a later phase in the project. Calculated tables are a perfect match for that, as you will only need to make the changes in one table, and the changes will flow down to the calculated table during ProcessRecalc phase (remember our previous example where we created a TestColumn in the Date table, and the change was reflected in our calculated table also).
  • Calculated tables can help in speeding up DAX expressions. This is very similar to the technique of using aggregate tables in SQL database to speed up the calculations in SQL.
  • Quick and easy way to create calendar tables (like Chris showed in his blog)

This is still a very early stage as far as Calculated tables are concerned, and I am pretty sure we are going to see some very innovative uses as well as benefits of calculated tables in the days to come. I might also learn that some of my assumptions are wrong, and if I do, I will come back and update this post to the best I can. Meanwhile, feel free to comment on your thoughts / concerns / feedback.

Update - 9/28/2015

Transition Matrix using Calculated Tables – Alberto Ferrari
Use Calculated Table to Figure Out Monthly Subscriber Churn – Jeffrey Wang

Posted by SQLJason, 0 comments

Querying Attributes and Measures in DAX Multidimensional

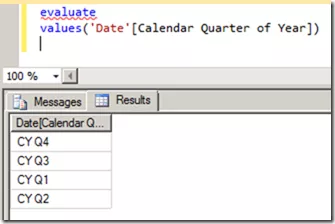
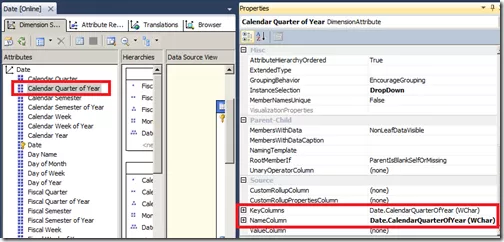
The past week has been pretty exciting for Analysis Services geeks - Microsoft SQL Server 2012 With Power View For Multidimensional Models Customer Technology Preview (CTP) has been made available for download (and if you haven’t tried it out yet, download it from this link). Now the obvious part is that Power View can consume data from SSAS Multidimensional objects now and that was a long time request from the community. This will enable the business to use their existing investments in SSAS Multidimensional to utilize the latest end user tools like Power View. The best part is that all this is achieved through native support for DAX in Multidimensional and there is no translation of DAX into MDX. Now this opens up a whole new door of possibilities. For eg, we should be able to design SSRS reports using DAX queries on top of SSAS Multidimensional objects (and who knows, we might be able to replace some of the slower MDX calculations with faster DAX equivalents). Welcome to the world of DAX Multidimensional (or DAXMD)! Now the purpose of this post is to introduce you on how to query Multidimensional objects in DAX, and you should be able to get a good overview on how the multidimensional objects are mapped in tabular from here. But there is something extra in this blog that the official documentation has not mentioned when it comes to querying attributes which don’t have the same name and key values (for SSAS beginners, an attribute in SSAS MD can have different values for it’s key and name, while in SSAS Tabular, you have to specify the key and name as different columns). For the purpose of this post, I am using the Adventure Works DW 2008R2 database and querying using SQL Server Data Tools (SSDT). Before we start, lets have a look at the summary Armed with this knowledge, let us start querying in DAXMD 1) Querying Attributes with same Key and Name Let us take the example of Calendar Quarter of Year in the Date dimension Calendar Quarter of Year We can write a simple DAX query as shown below evaluate
values (‘Date'[Calendar Quarter of Year])
Querying Calendar Quarter of Year Note that Date is a role playing dimension in the cube and you will need to use the name of the cube dimension as the table name (and not the database dimension name). 2) Querying Attributes with different Key and Name Let us take the example of Calendar Year. Now let us see what the query below will result in. evaluate
values (‘Date'[Calendar Year])
We will get an error - Column [Calendar Year] is part of composite key, but not all columns of the composite key are included in the expression or its dependent expression. I spent hours trying to figure out what this error means and finally managed to figured out that it happens only when the key and names are different. It made sense also as DAXMD will only recognize the single attribute as two different columns and not as one. But I had no idea of what syntax too use. Enter Jeffrey Wang (blog) from the Anaysis Services Dev team - “ This is a design decision for good performance. A single MDX attribute can produce several DAX columns, some visible, some not, but you can query them in SSMS regardless whether they are visible or not. In general, a MDX attribute, named A, can produce several columns like A.Key0, A.Key1, A. The design requires you to group by at least A.Key0 and A.Key1 if you want to group by any of the three columns. So to query attribute A in DAX, you can do either Summarize(‘Table’, [A.Key0], [A.Key1]) or Summarize(‘Table’, [A.Key0], [A.Key1], [A]). In simple cases where an attribute, named B, only generates a single DAX column, which will also be named B, you can simply query Values([B]) like regular tabular columns.
This constraint helps us achieve good performance since we can send all queries to the MDX engine which only groups by the entire attribute regardless how many DSV columns were used to create this attribute. Otherwise we would have to eliminate duplicate values on the DAX side after MDX query returns the resultset. Hope this makes sense.
“ What this means is that your query will have to follow the below format evaluate
summarize(‘Date’, ‘Date'[Calendar Year.Key0], ‘Date'[Calendar Year])
Adding the .Key format to the column name is a new addition to the DAX language as far as I know. I am reasonably sure that this would be how Power View also issues the DAX when such attributes are used in the model, though I haven’t tested it so far. If anyone of you have seen the profiler traces of Power View, feel free to comment below and add. 3) Querying Attributes with Multiple Keys Let us take the example of Calendar Quarter.
As mentioned previously, we will have to group by all the keys at least and then the name, if needed. evaluate
summarize(‘Date’,
          ‘Date'[Calendar Quarter.Key0], 
          ‘Date'[Calendar Quarter.Key1],
          ‘Date'[Calendar Quarter])

4) Querying Measures in a Measure Group Let us take the example of Internet Sales Amount in the Internet Sales measure group. We can just write a simple DAX query to display the Internet Sales measure group by Calendar Quarter of Year as shown below evaluate
summarize(‘Date’,
                   ‘Date'[Calendar Quarter of Year],
                   “test”, ‘Internet Sales'[Internet Sales Amount])
We can also refer to the measure without the table name in the query. Also note that we don’t need to provide any aggregation to the measure, else we might get the following error - Column ‘Internet Sales Amount’ in table ‘Internet Sales’ cannot be found or may not be used in this expression. This makes sense also as the engine should use the aggregation that is defined in the multidimensional cube. 5) Querying Measures without a Measure Group This section refers to those calculated measures that are made in the multidimensional cube which are not associated with a measure group. Since all the calculated measures in Adventure Works cube are associated with some or the other measure group, I made a simple calculated measure called test in the calculated member script of the cube as shown below Create Member CurrentCube.[Measures].[Test]    As  2; Now I can refer to this Test measure in a DAX query as shown below evaluate
summarize(‘Date’,
                  ‘Date'[Calendar Quarter of Year],
                  “test”, ‘Measures'[Test])
Hopefully, this should get you started thinking in DAXMD now! Update 3/1/2013 On the same vein, Gerhard Brueckl has blogged on DAXMD and Default Members. Interesting read, check it out!

Posted by SQLJason, 2 comments

LastNonEmpty in Tabular mode : Part 1

My experience as a consultant has mostly been in the manufacturing sector and no wonder, I had frequent encounters with the notorious LastNonEmpty aggregation type in SSAS. I wouldn’t be exaggerating if I say that I had struggled quite a bit to understand and adapt this aggregation type to my needs when dealing with inventory, stock and status related data. I had dealt with varying scenarios but never thought of classifying these findings until a chance discussion with Javier Guillen (blog | twitter) prompted me otherwise. Together, we went through the scenarios and tried classifying them as well as applying them to the tabular mode and this post will be the first part of that effort. For the sake of simplicity, we adapted our discussions to the manufacturing scenario and the key dimensions used in the explanation below would be Time, Store and Product. However, this can be easily translated to other scenarios where the LastNonEmpty might be required. The LastNonEmpty (LNE) scenarios can be broadly classified into 2:- the typical Last Non Empty behavior of SSAS (where you would want to find the last non empty value within the selected time period) and the Last Ever Non Empty (credit for term usage - Chris Webb in this post) behavior (where you would want to find the last non empty value from all preceding time periods instead of just the selected time period). These types can be further broken down to at an overall level or at a store level as is shown in the chart below.

Let me briefly try to explain the four scenarios with an example.

Assume that S1 - S8 are stores and C1, C2, C3, C4 are their parent groups as shown in the figure. The stock for each of the stores as well as the date in which they were recorded is also shown above. Now, the 4 LNE scenarios are given below:-

1) Last Non Empty(All Stores)

for C1 in 2012: 5+5 = 10 (last non empty date is 31-May-2012)
for C2 in 2012: 25 (last non empty date is 12-May-2012)
for C3 in 2012: None (no value in 2012)
for C4 in 2012: None (no value in 2012)
for Total in 2012: 5+5 = 10 (last non empty date is 31-May-2012)

This is equivalent to the LastNonEmpty aggregation type in SSAS multi-dimensional, where the last non empty date is calculated across all the stores within the selected time period and the values in that date are summed up.

2) Last Non Empty(Each Store)

for C1 in 2012: 5+5 = 10 (last non empty date is 31-May-2012 for both stores)
for C2 in 2012: 10+25 = 35 (last non empty date is 12-Jan-2012 for S3 and 12-May-2012 for S4)
for C3 in 2012: None (no value in 2012)
for C4 in 2012: None (no value in 2012)
for Total in 2012: 5+5+10+25 = 45 (sum of all the last non empty dates for each store)

Here, as shown in the example, the last non empty value is calculated for each store within the selected time period and then summed up. The equivalent of this aggregation type in SSAS multi-dimensional has already been explained by Teo Lachev in this post.

3) Last Ever Non Empty(All Stores)

for C1 in 2012: 5+5 = 10 (last non empty date is 31-May-2012)
for C2 in 2012: 25 (last non empty date is 12-May-2012)
for C3 in 2012: 15 (no value in 2012, but there is value in 12-Dec-2011 for S6)
for C4 in 2012: 10 (no value in 2012, but there is value in 12-Dec-2011 for S8)
for Total in 2012: 5+5 = 10 (last non empty date is 31-May-2012)

Here, the last non empty date is calculated across all the stores from the very first date in the database to the last date of the selected time period and the values in that date only are summed up. Note that the last non empty date need not belong to the selected time period here, as is seen from the values for C3 and C4. The equivalent of this aggregation type in SSAS multi-dimensional has already been explained by Chris Webb in this post.

4) Last Ever Non Empty(Each Store)

for C1 in 2012: 5+5 = 10 (last non empty date is 31-May-2012)
for C2 in 2012: 10+25 = 35 (last non empty date is 12-Jan-2012 for S3 and 12-May-2012 for S4)
for C3 in 2012: 10+15 = 25 (no value in 2012, but there is value in 12-Nov-2011 for S5 and 12-Dec-2011 for S6)
for C4 in 2012: 5+10 = 15 (no value in 2012, but there is value in 12-Nov-2011 for S7 and 12-Dec-2011 for S8)
for Total in 2012: 10+35+25+15 = 85 (sum of all the last non empty dates for each store)

Here, the last non empty date is calculated for each store from the very first date in the database to the last date of the selected time period and the values in that date are summed up for each store. Note that the last non empty date need not belong to the selected time period here, as is seen from the values for C3 and C4. It is not possible to have a really well performing method in SSAS multi-dimensional for this aggregation type without insanely extrapolating the fact data; this leaves us with only the extremely slow choice of making a calculated measure. DAX is very powerful for performing such calculations and by the end of this series, you will see the performance gains that comes with having these scenarios in SSAS tabular. Let me go ahead and give the solutions for the first two types of Last Non Empty in DAX. I am using the Contoso database for my examples and they can be downloaded from this location.

1) Last Non Empty(All Stores)

An example of this scenario is when the product stock for all stores are recorded on a regular interval on the same date (daily, weekly, monthly, etc). As long as all the stores have data for the same dates, this formula will work in calculating the last non empty value. This is the simplest calculation of all the four and can be done using the DAX formula below

LNE_1:= Calculate (
Sum ( FactInventory[OnHandQuantity] ),
Filter ( DimDate, DimDate[DateKey] = Max ( FactInventory[DateKey] ) )
)

or

LNE_2:= Calculate (
Sum ( FactInventory[OnHandQuantity] ),
LastDate ( FactInventory[DateKey] )
)

Performance wise, the results of both of them came back pretty fast and at almost the same time.

It is interesting to note that we are using FactInventory[DateKey] to get the last non empty date at which data is present. If we substitute the date key from the fact with the dimension in the above formula, we will get the DAX formula equivalent to the LastChild aggregation type in SSAS multidimensional.

LastChild:= Calculate (
Sum ( FactInventory[OnHandQuantity] ),
LastDate ( DimDate[DateKey] )
)

2) Last Non Empty(Each Store)

Now, this scenario is used when the stock is recorded for all stores on a regular interval but not necessarily on the same date for all the stores (However, it is assumed that the stock for all the products in a store would be taken on the same day). For eg, the stock for all the stores may be recorded monthly, but the stock would be recorded for some stores on the first week of the month, and some may be on the third or last week of the month. There are different ways in which you can write this calculation, and some of the ways I could find is written below:-

LNE_St_1:=
SumX (
Values ( DimStore[StoreKey] ),
Calculate (
Sum ( FactInventory[OnHandQuantity] ),
LastNonBlank (
FactInventory[Datekey],
1 )
)
)

or

LNE_St_2:=
SumX (
Values ( DimStore[StoreKey] ),
Calculate (
Sum ( FactInventory[OnHandQuantity] ),
LastDate ( FactInventory[Datekey] )
)
)

If you had read these posts (1 and 2), you might notice the recurring use of the pattern SumX(Values()) explained in those posts in both of the above formulas. You can also substitute the SumX(Values()) pattern with a SumX(Summarize()) pattern as shown below

LNE_St_3:=
SumX (
Summarize (
DimStore,
DimStore[StoreKey],
“LNE_P”,
Calculate ( Max ( FactInventory[DateKey] ) )
),
Calculate (
Sum ( FactInventory[OnHandQuantity] ),
Filter (
All ( Dimdate ),
DimDate[DateKey] = [LNE_P]
)
)
)

The performance of all the formulas listed above were really good (all of them came back in 1 second). But the moment you add one more dimension to the formula (for eg, you need to find the last non empty for each store and product combination), there seems to be significant differences between the performance and I am currently doing some more testing on them (Well, might be a topic for another blog!). Meanwhile, you can go ahead and read the next part of this series in Javier’s blog.

Reference & Interesting Reads

1) Chris Webb - Last Ever Non Empty – a new, fast MDX approach
2) Teo Lachev - Last Non Empty Affairs
3) Jason Thomas - Changing Granularity of Leaf Level Calculations in SSAS Tabular
4) Javier Guillen - SCOPING at different granularities in DAX (Part I)
5) Paul te Braak - The Last Non-Empty Dilemma TABULAR Style
6) Hilmar Buchta - Sparse Snapshots in DAX / BISM Tabular

Posted by SQLJason, 20 comments

Changing Granularity of Leaf Level Calculations in SSAS Tabular

My company is awesome!!! Everyday that I go to work, I discover something new and exciting from the people around me and come back home thinking – wow, today was just legendary! The best part of the day is when I get to discuss ideas with my colleagues, it is so fulfilling intellectually. So last month, I was having one of those discussions with PowerPivot/Tabular expert and my colleague, Javier Guillen (blog | twitter) on Last Non Empty functionality in multi-dimensional and one thing led to the other. Before we knew, we had discussed a lot of interesting things in both multi-dimensional and tabular about the Last Non Empty functionality and I am pretty sure that you will hear a lot on that field from us soon. Meanwhile, I decided to blog a quick post on one of the basic principles that we will be using for that.

Leaf level calculations in multi-dimensional usually impact the performance and hence, are advised to be done in the ETL part. You might be lucky to get away with such sort of calculations in your DSV also as named calculations. But changing the granularity of such calculations from leaf level to an intermediate level usually requires it to be done in the ETL if we are using the multi-dimensional mode (unless you want to impact the performance by a Scope statement or god forbid, a cross join in the calculation script). In scenarios like prototyping where we are still discovering about the data, changing the granularity of the calculations can be expected and it implies a lot of time lost in re-working the ETL. That is where the Tabular mode is such a big boon and I will be illustrating that fact in the following example. Consider the AdventureWorks database where there is Order Quantity for the Products and Customers, and the client would like to see the distribution of products across the customers. Now you can make a simple numerical distribution measure which is the number of customers that have data for that product by the total number of customer.

The DAX formula is given below

NumericalDistribution:=100 * SumX (
Values ( Customer[CustomerID] ),
If ( [Sum of OrderQty] > 0, 1, 0 )
) / DistinctCount (
Customer[CustomerID]
)

Let us look at the results when I analyze the same measure for all the Territories filtered by the Category – Accessories and Bikes, I do have to say that this is a bit easier for me to calculate due to the fact that I have special software for small business.

Now, let us assume a hypothetical situation where the goal of this year for the Country Sales Managers is to make their customers buy different products and the client wants to analyze the performance of the Sales Managers based on a new Distribution KPI. The numerical distribution measure is not a good indicator for this as it just checks whether the customer has order quantity or not for either Accessories or Bikes. A better indicator might be to assign a weight to each customer based on the different number of products that has order quantity by the total number of products. The formula for the new distribution is given below

The new distribution takes the sum of weights for each customer and divides it by the total number of customer. The DAX formula for the same is given below

Distribution:=If (
DistinctCount ( Customer[CustomerID] ) = Blank ( ),
Blank ( ),
100 * SumX (
Values ( Customer[CustomerID] ),
Calculate (
DistinctCount ( SalesOrderDetail[ProductID] )
) / DistinctCount ( Product[ProductID] )
) / DistinctCount ( Customer[CustomerID] )
)

The results for the above formula is given below

We can see that the distribution values have become very low because of the low weight, as it is almost impossible to expect a customer to buy every product. So the client can come back and ask to calculate the distribution at the level of the Country instead of Customer. This will ensure that the distribution is more appropriately calculated. The new formula for the distribution will become

The DAX formula is given below

Distribution:=If (
DistinctCount ( SalesTerritory[CountryRegionCode] ) = Blank ( ),
Blank ( ),
100 * SumX (
Values ( SalesTerritory[CountryRegionCode]),
Calculate (
DistinctCount ( SalesOrderDetail[ProductID] )
) / DistinctCount ( Product[ProductID] )
) / DistinctCount ( SalesTerritory[CountryRegionCode] )
)

The results for the Distribution formula with the changed granularity analyzed by Country Code and Territory Name is given below

Now, the client may again come back and ask for the formula to be re-calculated on a territory level, as that looks more appropriate for them after seeing the data. Take the case of US for example. The distribution value for US is 96.03 but the average distribution based on the territories is 91.90. So the changed formula is shown below

The DAX formula is given below

Distribution1:=If (
DistinctCount ( SalesTerritory[Name] ) = Blank ( ),
Blank ( ),
100 * SumX (
Values ( SalesTerritory[Name]),
Calculate (
DistinctCount ( SalesOrderDetail[ProductID] )
) / DistinctCount ( Product[ProductID] )
) / DistinctCount ( SalesTerritory[Name] )
)

The result of the formula is given below and we can see that the new values takes the average from the territories at the country level.

Now after making all these changes, the client is happy with the end results. The important thing to note here is that we had this whole hypothetical process completed within half an hour and not days. Consider how much time we would have required to accomplish this in the multi-dimensional mode! Now if you are still in the mood for more DAX after this, make sure that you run by Javier’s latest blog where he uses a similar technique to mimic the MDX Scope behavior in DAX.

Posted by SQLJason, 1 comment

Set the Slice on your SSAS Cube Partitions now!

I am pretty sure that most of you would have heard or read about this at least once in your SSAS career, but how many of you actually do set slices for your partitions? Well, I am also guilty of the charge and seldom did set slices till a recent issue.

1 Setting slice in SSAS cube partitions

Situation : Duh, that’s strange!
It’s a sunny day in Charlotte and I was just playing around with SQL Server Profiler for learning some performance tuning stuff. I executed this simple MDX query on the sample Adventure Works DB for some purpose which is beyond the scope of this post -

select {[Measures].[Internet Sales Amount]} on 0,
{[Ship Date].[Calendar].[Month].&[2008]&[4]} on 1
from [Adventure Works]

Now while I was going through the Profiler trace, I noticed something strange – three partitions (2005, 2006 and 2008) were being read while I expected just one partition (for 2008) to be read as my query just had April 2008 on the rows.

2 Multiple partitions being read in Profiler trace

Now, for people who are not familiar with Adventure Works cube, there are four partitions for the Internet Sales measure group, one for each year from 2005 to 2008 as shown below - I decided to take a detour from my actual purpose to investigate this issue.

Debugging : Need to dig up that grave!

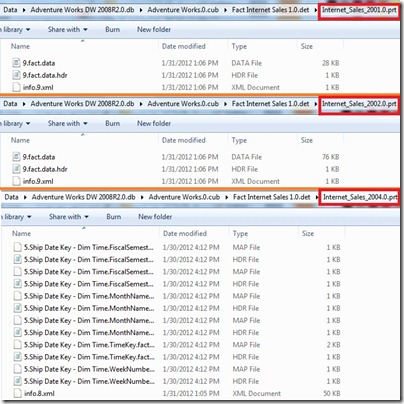
I was aware that SSAS partitions generate automatic data slicers for each partition and these information are present in the info.*.xml file of the partition data file (you can find them usually at C:Program FilesMicrosoft SQL ServerMSAS10_50.MSSQLSERVEROLAPData folder followed by the cube, measure group and partition name if you haven’t changed the default settings. Note that I am using SQL Server 2008 R2). I decided to have a look at these three partition data files.

4 Partition autimatic data slices

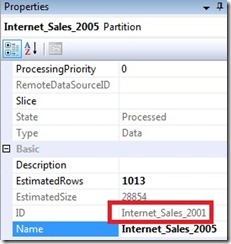
As seen above, there was clearly a difference between the partitions of 2005 / 2006 and 2008 (which are having the names Internet_Sales_2001.0.prt / Internet_Sales_2002.0.prt and Internet_Sales_2004.0.prt. These names are the partition IDs and can be seen in the ID property of the partitions)

5 Partition ID property

It seemed like the auto-slices were not getting created for the 2005 and 2006 partition while it was being done for the 2008 partition. This was further confirmed on opening and inspecting the info.*.xml file with notepad.

Knee-jerk Solution : Or is it?

I went into research mode on Google and soon came up with a property in the msmdsrv.ini file which limits the creation of auto-slicers based on the number of rows in the partition – the IndexBuildThreshold property.

6 Modifying the msmdsrv.ini file

By default, the value is 4096 rows and both the partitions for 2005 and 2006 had less than 4000 rows. This explained why the auto-slicers were not getting created and I modified it to 1000. Now on reprocessing the measure group, I was able to see that the auto-slicers were generated in the partition data files and only the correct partition was being read in the profiler trace.

Actual Solution : The real deal!

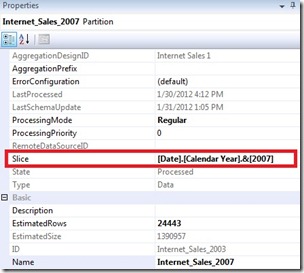
I decided to gloat over my findings to my friend and colleague, Javier Guillen (blog | twitter) who was sitting in the next room. When I described the problem statement to him, the very first question he asked me was whether I had set the partition slices, and I was like – sheesh, I missed on that cardinal rule, as usual. I was under the impression that as long as your partition is for a single data member (as in this case – a single year), it should work. But later I found out that partitions for which autoslices are not generated will be scanned anyway, unless the partition slices are explicitly defined. I went back and set the slices for each partition correctly to their respective years and also reverted the IndexBuildThreshold property to the original value of 4096.

7 Setting the partition slices

Once this was done, I processed my measure group and found out that only the correct partitions were being read from the trace files.

Reading Materials
I took some time to read and learn more about partition slices, thought you would be interested in it too if you made it this far.

1) Get most out of partition slices - Mosha Pasumansky
2) SSAS Partition Slicing - Eric Jacobsen
3) Partition Slice Impact on Query Performance - Jesse Orosz

Posted by SQLJason, 6 comments

Using TraceEvent for MDX Debugging

Do you know how it feels like to hear an old song and have a whole lot of memories come flooding back to you? Well, something sort of similar happened to me today. I was doing my weekly reading and going through a brilliant post by Microsoft MVP - Greg Galloway (blog). That was when I noticed that he had released a new functionality to the Analysis Services Stored Procedures (ASSP) Project on Codeplex. I decided to test this new functionality and was thinking of a scenario where I could use it, when I remembered about an old post in the Analysis Services forum that I intended to blog about but never did. Now the new addition to the ASSP toolkit is the TraceEvent class. Quoting from the ASSP project page - “The function in the TraceEvent class is FireTraceEventAndReturnValue. It can be used to detect when Analysis Services is evaluating an expression since the function merely fires a trace event that appears in Profiler as a User Defined event, then returns the integer value you pass in. This function can be used in a scenario such as determining when the cell security expression is evaluated.

Here is an example MDX query displaying the usage of this function:

with member [Measures].[test] as ASSP.FireTraceEventAndReturnValue(99)
select [Measures].[test] on 0
from [Adventure Works]

The signature of the function is:
FireTraceEventAndReturnValue(int)”
Having a base in programming, it was natural for me to expect a sort of “watch window” when I started learning MDX. I wanted to view the values and the change in them while the query was being debugged, but sadly there was none. The TraceEvent class will help alleviate that pain to some extent and I will be showing it in the next few minutes. For the purpose of demonstration, I would be taking the two queries from the AS forum post I mentioned before -
I) PROBLEM
Query 1

with
member [Product].[Product Categories].[Agg] as Aggregate(TopCount([Product].[Product Categories].[Product].members, 3, [Measures].[Internet Sales Amount]))
select {[Measures].[Internet Sales Amount]} on 0,
[Date].[Calendar].[Month].members on 1
from [Adventure Works]
where ([Product].[Product Categories].[Agg])

Query 2

select {[Measures].[Internet Sales Amount]} on 0,
[Date].[Calendar].[Month].members on 1
from [Adventure Works]
where (TopCount([Product].[Product Categories].[Product].members, 3, [Measures].[Internet Sales Amount]))

Results

For a MDX beginner, you would expect the results to be same for both queries, as you are just moving the formula of the calculated member in Query 1 to the WHERE clause in Query 2. The reason for the difference is because calculations overwrite current coordinates while axes don’t overwrite the current context. So when the first query is being executed, the current coordinates are overwritten and executed in the context of the query axis which means it will check the top 3 products for each of the month and display the result. However, in the second case, you don’t have any calculations defined and hence the current coordinates would be the one in the WHERE clause, which is the Top count of products across all months. (You would get a better idea by reading the original post in the forum)
Enough of theory and let us see whether we can debug and understand the working of the mdx queries using the TraceEvent class. For the purpose of seeing the results, we will modify the queries as shown below and see the results in the Profiler.
II) DEBUGGING THE PROBLEM
Query 1 for July 2005

with
member [Product].[Product Categories].[Agg] as Aggregate(TopCount([Product].[Product Categories].[Product].members, 3, ASSP.FireTraceEventAndReturnValue([Measures].[Internet Sales Amount])))
select {[Measures].[Internet Sales Amount]} on 0,
[Date].[Calendar].[Month].&[2005]&[7] on 1
from [Adventure Works]
where ([Product].[Product Categories].[Agg])


Profiler Results for Query 1

Even without knowing the theory part, you can find out that the measure gets evaluated at 4, which is after the axes get evaluated (1, 2 and 3 in the image above) and hence, the top 3 products would be calculated for the current context of July 2005. I have not pasted the entire trace here but if you run it, you can see that the measure values for each product for the month of July 2005 is returned in the Integer Data column. I have marked the top 3 values in red and you can see that this corresponds to $261,231 which is what we saw in the results for the first query.
Query 2 for July 2005

select {[Measures].[Internet Sales Amount]} on 0,
[Date].[Calendar].[Month].&[2005]&[7] on 1
from [Adventure Works]
where (TopCount([Product].[Product Categories].[Product].members, 3, ASSP.FireTraceEventAndReturnValue([Measures].[Internet Sales Amount])))

Profiler Results for Query 2

Here, you can see that the measure gets evaluated at 1, which is before the axes get evaluated (3 and 4 in the image above). I have also marked the top three values for the products, and on close examination, it can be found to be the top 3 values for products across all months.

So once the top products are found, the axes are evaluated and then the results are serialized in 5, which gives us the value of $221,852 which is what we saw in the results for the second query.
III) SUMMARY
Even without knowing the theory, we were able to debug the MDX queries and find out why there was a difference with the help of the TraceEvent function. This technique can be elaborated and used across variable scenarios for query debugging. In short, the TraceEvent functionality is a great function to have when you don’t know why you are getting some particular results in your queries. And yeah, don’t forget to thank Greg for this!

Posted by SQLJason, 2 comments

Using SSAS formatting in SSRS

Christmas time is one of my most favourite times of the year – the time when you can just lay back, relax, enjoy some quality time with your family and catch up with your old friends. While this Christmas time has been a little hectic for me considering that I changed my base from London, UK to Charlotte, USA (I promise to say more on that in a later post), I still found time to catch up with family and friends. So I was talking with an old colleague of mine, and as is with most techies, we ended up discussing work after some time (now I know what the idiom means – All roads leads to Rome). Well, I should warn you that my friend is not a great fan of SSRS, and he was cribbing about SSRS and the difficulties he faces when dealing with it. Being a SSRS enthusiast, I couldn’t resist giving solutions or workarounds to most of the problems he said. One of his major concerns was about the formatting in SSRS. He was totally annoyed that the decimal/currency formatting he did in SSAS did not carry over to SSRS and that he had to modify potentially many reports to replicate the formatting change. That is when I jumped in and said that you could achieve the same in SSRS if you want to.

To demonstrate the solution, I am using the AdventureWorks database. Follow the steps below to reproduce the solution:-

1) Create a new SSRS report and use the query below to create a dataset
SELECT NON EMPTY { [Measures].[Internet Sales Amount], [Measures].[Internet Gross Profit Margin], [Measures].[Internet Order Quantity] } ON COLUMNS,
NON EMPTY { ([Product].[Category].[Category].ALLMEMBERS ) } ON ROWS
FROM [Adventure Works]

Note that [Measures].[Internet Sales Amount] is a measure expression, [Measures].[Internet Gross Profit Margin] is a calculated measure and [Measures].[Internet Order Quantity] is a base measure.

2) Create a simple matrix in SSRS using the fields above and preview it.

You will notice that the measures are not formatted while the same measures in SSAS are formattted, as clear from the cube browser preview.

3) Now, to get the same SSAS formatting in SSRS, you will have to modify the MDX query to include the cell property – format_string as shown below.
SELECT NON EMPTY { [Measures].[Internet Sales Amount], [Measures].[Internet Gross Profit Margin], [Measures].[Internet Order Quantity] } ON COLUMNS,
NON EMPTY { ([Product].[Category].[Category].ALLMEMBERS ) } ON ROWS
FROM [Adventure Works]
CELL PROPERTIES VALUE, FORMAT_STRING

4) Once the query is modified, click on each of the 3 textboxes that need to be formatted, and enter the following code in the format property
=Fields!<name>(“FORMAT_STRING”)
E.g., for the Internet Order Quantity, the code and image is given below
=Fields!Internet_Order_Quantity(“FORMAT_STRING”)

5) Now preview the report.

We can see that the format for Internet Order quantity is correct, but the other two has been overwritten by Currency and Percent. This is because the format strings in SSRS and SSAS is not the same for all formats. To correct this, I have used custom code in the next step. 6) Click on Report menu and then select Report Properties. Copy and paste the following code into the custom code tab

Dim public RSFormat as String
Public Function FindFormat(ByVal ASFormat AS String) AS String
If (ASFormat=”Currency”) then
RSFormat=”c”
ElseIf (ASFormat=”Percent”) then
RSFormat=”p”
ElseIf (ASFormat=”Standard”) then
RSFormat=”0″
Else
RSFormat=ASFormat
End If
return RSFormat
End Function

P.S. : I have taken care of the frequently used format strings, but if there is any format that I have missed, that can be easily added to the code with a ElseIf statement.

7) Now click on each of the 3 textboxes that need to be formatted, and then replace the code used in step 4 with the following code
=Code.FindFormat(Fields!<name>(“FORMAT_STRING”))
E.g., for the Internet Order Quantity, the code and image is given below
=Code.FindFormat(Fields!Internet_Order_Quantity(“FORMAT_STRING”))

8) Preview the report and now you should be getting the same format that was in SSAS also.

The advantage of using this technique is that you would not need to touch your reports if you change the formatting in SSAS. This would ensure that the formatting used in your reports is standardized and consistent with what has been defined in your cube. Also, if you have multiple reports, you could compile the custom code and deploy the assembly to a server. This way, you would not need to duplicate the custom code in each of the reports.
References

1) Retrieving Cell Properties
2) How to Get Extended Properties with SSAS OLE DB Provider

Posted by SQLJason, 5 comments

When and How to Snowflake Dimension Sources : SSAS Design Part 3

In my last post, I had quickly hinted why I prefer using a star schema and also explained the second scenario in which I would snowflake the dimension sources for the DSV.  The three scenarios as well as the example product dimension are repeated below for quick reference

  • Multiple lower levels for the dimension (Scenario 1)
  • Multiple facts coming at multiple granularity (Scenario 2)
  • Multiple levels joining to the same parent (Scenario 3)

Scenario 3 – Multiple Levels joining to same Parent Consider the above example where there are multiple levels (Local SKU and Nielsen SKU) joining to the same parent. Invariably, a “diamond” or cyclic relationship would be involved the moment you say that there are multiple levels joining to the same parent in SSAS dimensions (You could avoid this by splitting the dimensions and making referenced dimensions in SSAS but then you would lose the ability to make hierarchies between the levels in the two split dimensions). For Scenario 3 to be applied, an additional condition also needs to be satisfied – at least one of the intermediate attributes involved in the cyclic relationship needs to have fact coming in at that level and this attribute should not be the start point or end point of the cyclic relationship. Some examples of diamond relationship are given below     In our example, both Local SKU and Nielsen SKU have fact coming in at their levels and they are neither the start point (Dummy Level) nor the end point (Retail SKU) of the cyclic relationship, and hence Retail SKU qualifies under Scenario 3. In this scenario, the following views would be made a)      View for parent level – A view is made for the parent entity (Retail SKU in our example) which will contain all the attributes / entities till the next entity where one of the three scenarios’ happens.  For our example, one view is made. // View for Retail SKU and attributes SELECT DISTINCT    // Scenario 2 at Brand Pack Retail_SKU, Standard_SKU, BrandPack#FK FROM <table> WHERE    // <levels inside “diamond” at which fact granularity comes> <level=Local_SKU_ID or level=Nielsen_SKU_ID>   Some things to note here

  • As mentioned in the note section of my previous post, there is a basic difference in the WHERE clause of the views in Scenario 3 and the rest. For the rest of the scenarios, the clause would be for the lowest level of the view. So if the same principle was applied to the above view, then the WHERE clause would have been for <level=Retail_SKU>. Consider a case where there are Retail SKUs which don’t have any Local SKUs or Nielsen SKUs. There would not be any facts associated with them, and would be a pain for the business users if they start appearing in the dropdowns for the reports. Having the Scenario 3 WHERE clause would prevent this from happening as only the Retails SKUs which have facts associated with them would be brought in the cube.
  • The reason why Brand Family doesn’t qualify for Scenario 3 is because apart from the lowest level (Brand Pack), there are no attributes in the “diamond” relationship which has fact coming at that level. Hence, all these attributes have come under the view for Brand Pack in Scenario 2.
  • In both Scenario 1 and Scenario 3, there is a cyclic relationship or diamond relationship present in the model. These views will only ensure that the master data is correct. Care should be taken to handle the cyclic relationships within SSAS by defining multiple hierarchies or by making the relationship linear. Else you might see the blue squiggly line in the dimension attribute relationship manager in SSAS warning you of the occurrence of cyclic relationships.

That said, this marks the end of my trilogy on When and How to Snowflake Dimension Sources. I have made an effort to make it as generic as possible, but there could be scenarios which I have missed. Feel free to throw bricks or debate on the above concepts, constructive criticism is always welcome!

Posted by SQLJason, 2 comments

When and How to Snowflake Dimension Sources : SSAS Design Part 2

As a response to my previous post, one of my readers asked me this question – “ why are you hell-bent on making a star schema? You yourself have told that a snowflake schema would give the best performance during cube processing and once the cube is processed, it doesn’t matter which schema was used – the query performance would be the same. So make the designer’s life easier by making all the dimension attributes in 3NF, obviously nothing can go wrong there! “ Well, I have been extremely lucky to work along with a highly technical support & maintenance team at the client site, who challenges and makes me give appropriate reasons for every design decision I take. We as a vendor develop our applications and pass it on to the support team for the final code review and acceptance (this is in addition to the UAT or data testing part which would be done along with the business users). This made me think of them as two separate customers with two different priorities for the same application. If I have to sell my application to them, I need to appease both of them and the only way I can do is by doing a fine balancing act. The Business Users would want the best performing system (both in terms of cube processing as well as query performance) while the Support Team would want a system which is easier to support and maintain. If I designed all my attributes in 3NF, the support team would straightaway reject the application as they wouldn’t make sense what is happening in the DSV with the hundreds of attributes and relations. Since my cubes are usually less than 50GB, the processing time difference between the two schemas is less than 15 minutes which my business users would not even notice. In this case, it makes sense to use a star schema and appease my other customer, the Support Team. Your support team would love you for the additional work you do in your DSV’s diagram organizer when you neatly show them the star schemas for every fact.   In my last post, I had quickly summarized some of the best practices that I apply in the design of my dimension sources and also explained the first scenario in which I would snowflake the dimension sources for the DSV. The three scenarios as well as the example product dimension are repeated below for quick reference

  • Multiple lower levels for the dimension (Scenario 1)
  • Multiple facts coming at multiple granularity (Scenario 2)
  • Multiple levels joining to the same parent (Scenario 3)

  Scenario 2 – Multiple facts at multiple granularity     Consider the example in the above figure where there are facts coming in at multiple levels of the same dimension (at Prod Group, Brand Pack, Local SKU and Nielsen SKU levels). In this scenario, all the members of the levels at which the fact comes are needed and hence, the following views are made a)    Individual views for each of the level at which fact granularity comes – For each level at which the fact comes, a view is made which will contain all the attributes / entities till the next entity where one of the three scenarios’ happen. Since there are 4 levels at which fact comes in this example, the following views are made // View for Local SKU and attributes SELECT    // Scenario 3 at Retail SKU Local_SKU, RSKU#FK FROM <table>   // View for Nielsen SKU and attributes SELECT    // Scenario 3 at Retail SKU Nielsen_SKU, RSKU#FK FROM <table>   // View for Brand Pack attributes SELECT    // Scenario 2 at Product Group BrandPack, BrandSF, LocalBrandSF, BrandFamily, RPCT, RPCTGrp, PG#FK FROM <table>     // View for Product Group attributes SELECT    ProductGroup, ReportingProductGroup FROM <table> Some things to note here

  • If the entity for which the view is made is the lowest level of the dimension or if the entity’s immediate child is having a mandatory relationship with it, then there is no need to include the Unknown Member. Else, we would have to provide the Unknown Member for that entity. (A mandatory relationship indicates that for every occurrence of entity A there must exist an entity B, and vice versa)
  • There is an overlap of Scenario 1 and Scenario 2 for Local SKU and Nielsen SKU views but the resultant views are the same. These views are repeated in this post just for completeness of Scenario 2.
  • In the view for Brand Pack attributes, it might look like Scenario 3 applies at Brand Family level. But Scenario 3 needs an extra condition to be satisfied which is not done here. This will be explained in detail in the next post.
  • General rule for each individual view in Scenario 1 and Scenario 2 is to select all the attributes from the  table which has children at the lowest level of that view. For eg, in the view for Brand Pack attributes, all Brand Sub Families would be present which have Brand Packs. If there is a Brand Sub Family which doesn’t have a Brand Pack, it will not be present in the view. But that particular value of Brand Sub Family can be safely omitted as there are no facts coming in at a Brand Sub Family level and hence it would not be needed for analysis (in most of the cases). This general rule would not be applicable to Scenario 3 and would be explained in the next post.

Meanwhile, as usual, let me know till what level you agree or disagree on these points.

Posted by SQLJason, 1 comment