So this happened yesterday – one of my customers pinged me and asked whether it is possible to set customized data alerts for her end users? I froze for a second, knowing that such a functionality is not available out of the box but knowing how flexible Power BI is, I decided to explore her use case further. Worst case, I know I have the backing of the world’s best product team, and could submit a request to build this for us. Basically, she wanted her end users to get data alerts if specific products got sold in the last 24 hours (which should have been easy with the regular data alerts functionality in Power BI), but the challenge was that she wanted her users to set (add/delete) their own products. As I said earlier, this functionality is not available out of the box but with the PowerApps custom visual for Power BI and some DAX, we can definitely create a workaround.
As with any of my PowerApps post, this is going to be long, so scroll to the bottom if you just want to see the end result.
Source
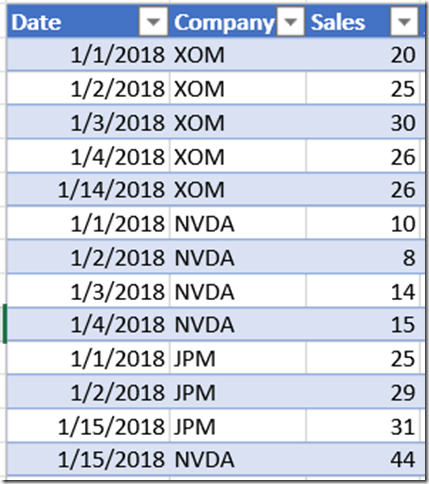
The data source that we will be using for this post is a simple excel file stored in One Drive for Business. The excel table gives the sales by company and date. The requirement is that the end users should get data alerts if any sales occurred in the previous day for any of the companies that they chose.
Solution Summary
To achieve the end result, we will create a table that maps the users to the companies, and then create a DAX measure in Power BI that shows the Sales if the conditions are met. The mapping of the companies to the users can be entered directly by the end users using a PowerApps custom visual within Power BI. The DAX measure can then be pinned to a dashboard and the alerts can be set on top of it. Also, Row Level Security has to be applied on the mapping table to ensure that the End user sees only his selections.
Solution
Follow the steps below:-
1) Create a user mapping table in an Excel file and store it in One Drive for Business (I am using Excel file stored in One Drive, but this could be any of the data source that PowerApps can read/write from and Power BI can read from). For now, I am adding 2 users – Admin and AdeleV and their selected companies for which they would like the data alerts.
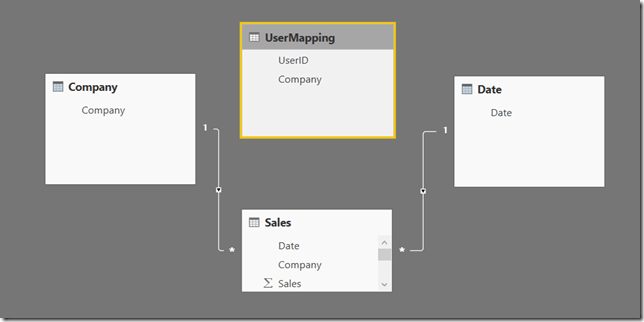
The model would look like below. Note that the UserMapping table is a disconnected table.
2) Create a measure that satisfies the 2 requirements – filter selected companies for the user and sales from yesterday.
CALCULATE (
SUM ( Sales[Sales] ),
TREATAS ( VALUES ( UserMapping[Company] ), Company[Company] ),
= ( TODAY () - 1 )
) + 0
3) Create a new role and set RLS for the UserMapping table. The intention is to filter the UserMapping table to the current user who has logged in and that can be done with the expression below
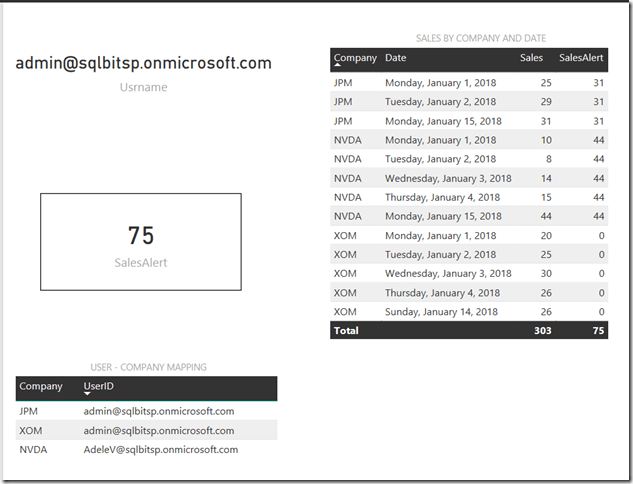
4) Create a simple report with the SalesAlert measure that we created in Step 2. Note that I am also adding the User name, UserMapping table as well as the Sales table so that you can see what is happening when we are logging in as different users. Right now, I am still logged in as Admin.
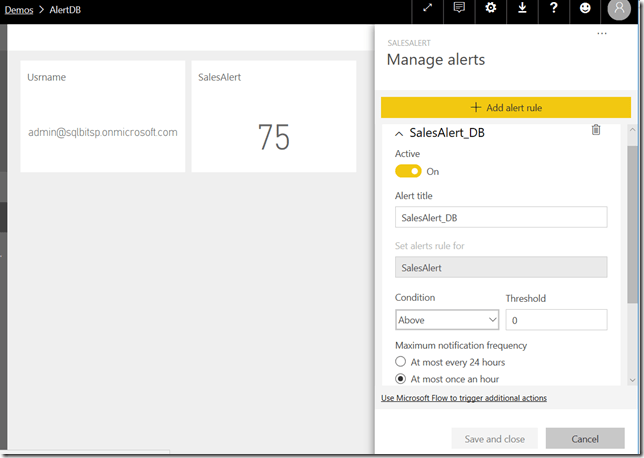
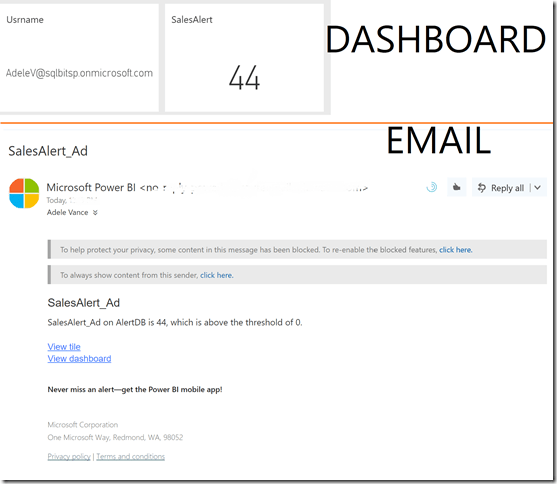
Pin the SalesAlert card to the dashboard (along with the Username card, so that you can see who is logging in). I also created a simple data alert that sends an email if the threshold is above 0. The dashboard is shown below
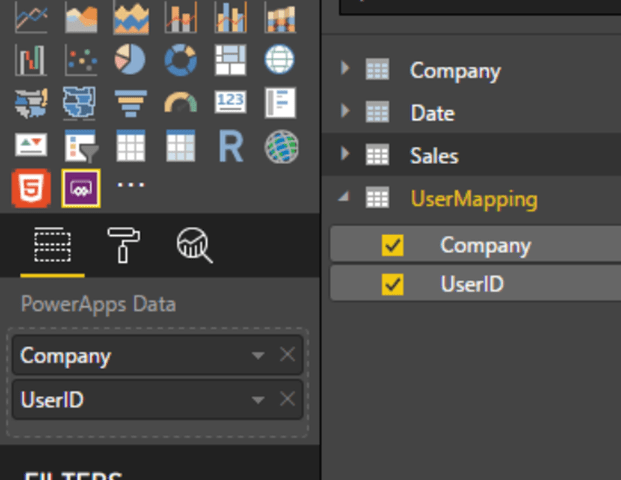
5) Go back to the Power BI report, edit it in the Power BI Service so that you can create a PowerApps custom visual. For this demo, I am passing the UserID and Company in Power BI.
6) Then, I created an app with 3 screens and the 2 data sources used are the UserMapping table in Excel as well as the Sales table in Excel. Let us look at the Home screen first, where we will display all the companies that are selected for the appropriate user.
The main highlights here are
- A plus icon to navigate to the AddScreen - OnSelect property set to Navigate(AddScreen, Fade)
- A dropdown to display the UserIDs from Power BI.
- Items property set to Distinct(PowerBIIntegration.Data, UserID)
- Default property set to First(PowerBIIntegration.Data).UserID
- A gallery to display the companies for the selected UserID
- Items property set to Filter(Mapping, UserID in Dropdown1.Selected.Value)
- NextArrow Icon to navigate to EditScreen – OnSelect property set to Navigate(EditScreen, Fade)
7) The next Screen is the EditScreen. This screen is used to delete an existing mapping.
The main highlights here are
- A X icon to cancel out from the screen – OnSelect property set to Navigate(HomeScreen, Fade); ResetForm(Form1)
- A trash can icon to delete the selected record – OnSelect property set to Remove(Mapping, CompanyGallery.Selected); Navigate(HomeScreen, Fade)
- An Edit form
- Data property set to Mapping
- Fields are Company and UserID
- Item property set to CompanyGallery.Selected
8) The last screen is the AddScreen and is used to add any new mappings for the end user.
The highlights from this screen are
- Edit form to add the records
- DataSource property set to Mapping and Item property set to Defaults(Mapping)
- Company and UserID fields are selected
- Company – Items property set to Distinct(Table1, Company) and Default property set to First(Table1).Company. This will display all the companies from the Sales table in the dropdown
- UserID – Default property set to User().Email
- X mark to cancel out from the screen – OnSelect property set to Navigate(HomeScreen, Fade); ResetForm(EditForm3)
- Tick mark to add the entry – OnSelect property set to SubmitForm(EditForm3); Navigate(HomeScreen, Fade); ResetForm(EditForm3)
9) Once you save and publish the app, also make sure that you are sharing it with all of the end users.
10) Save the Power BI report, and publish it as an app. Share the App with the end users (in my case, Adele and Alex).
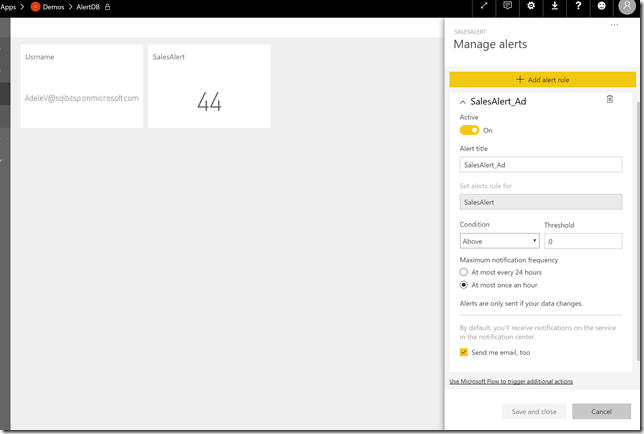
11) Make sure that the end users can access the App and also, make sure that each one of them creates a data alert on the dashboard with the same condition (just like we did in Step 4). The image below shows the data alert for Adele.
12) Now the users should start getting alerts for the companies that they have selected. Based on our data alerts,
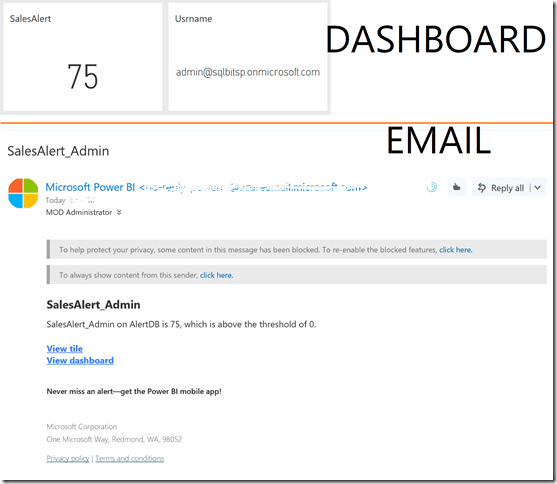
- Admin should get a data alert email if JPM, XOM or NVDA has a transaction for yesterday. Note that if you are an administrator, you will get the alert even if the data alerts for one of the end users’ condition is true. This is because the way we have setup the measure and Row Level Security, an administrator can see all the companies for all the users, and hence will get an alert if one of the selected companies has sales for yesterday (Jan 15).
- Adele should get a data alert email only if there is a transaction for NVDA (44 for Jan 15). In this case, she will get a data alert.
- Alex will not get a data alert as he has not selected any company.
13) Now login as Alex, and navigate to the report. Use the PowerApps custom visual that we created before to enter a new selection (in this case, JPM) for Alex. You can either wait for the dataset to be refreshed, or in my case, login as an admin and refresh the dataset manually. Once the dataset is refreshed, Alex can see the company that he selected in the mapping table, and can also see that the SalesAlert measure has been updated.
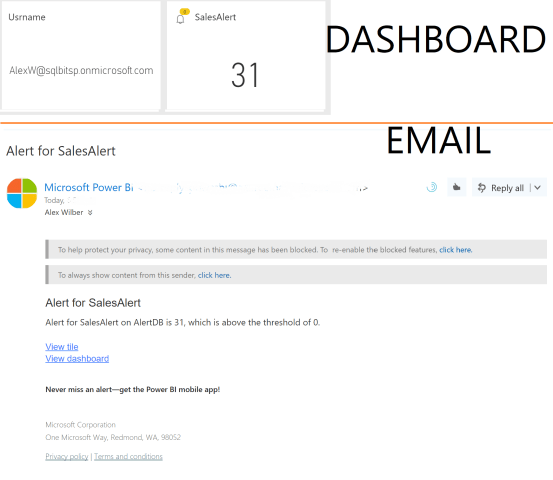
14) At this point, Alex should also receive an email alert.
Summary
Even though customized data alerts are not possible out of the box in Power BI (so far, as of 1/16/2018), it is possible to use the PowerApps custom visual, and make customized data alerts for each of the end users as well as give them the ability to modify / add their selections for data alerts.
Related
Adding Comments & Sending Emails in Power BI using PowerApps

