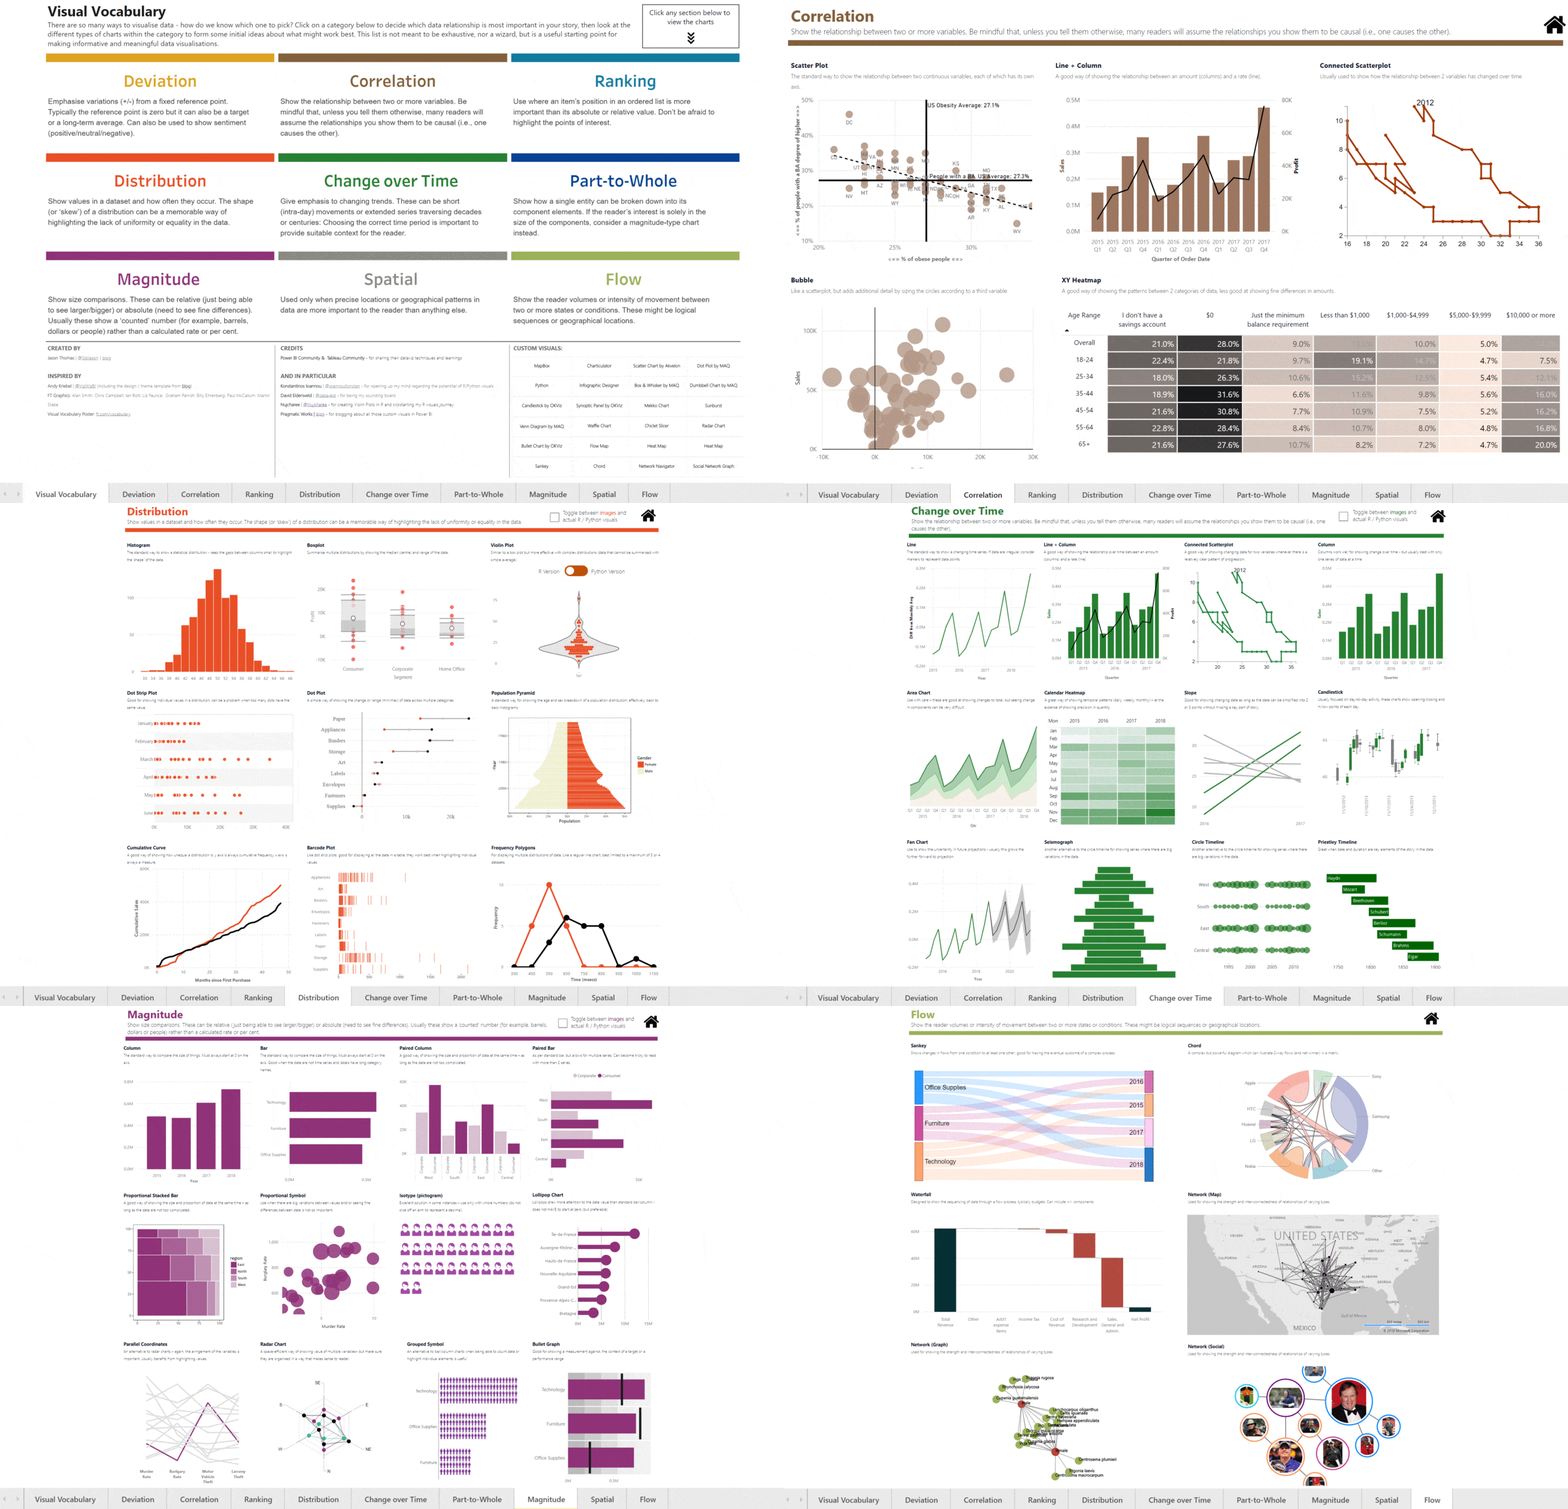
Ok, finally it is done! This is a side project that I have been undertaking on and off for the past 2-3 months, after getting inspired by Andy Kriebel’s (t | b) Tableau project - Visual Vocabulary. There were a lot of times when I thought it simply wasn’t worth the effort, and I dropped it. But somehow I managed to drag myself back into it and it truly has been a “labor of love” as Andy quoted it. The perfectionist in me is still not 100% happy with the end result, and I know for sure that there are ways to make it better. But I will still count it as a personal victory that I managed to get it this far!
Background
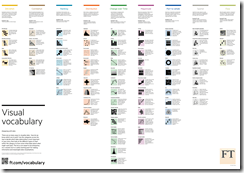
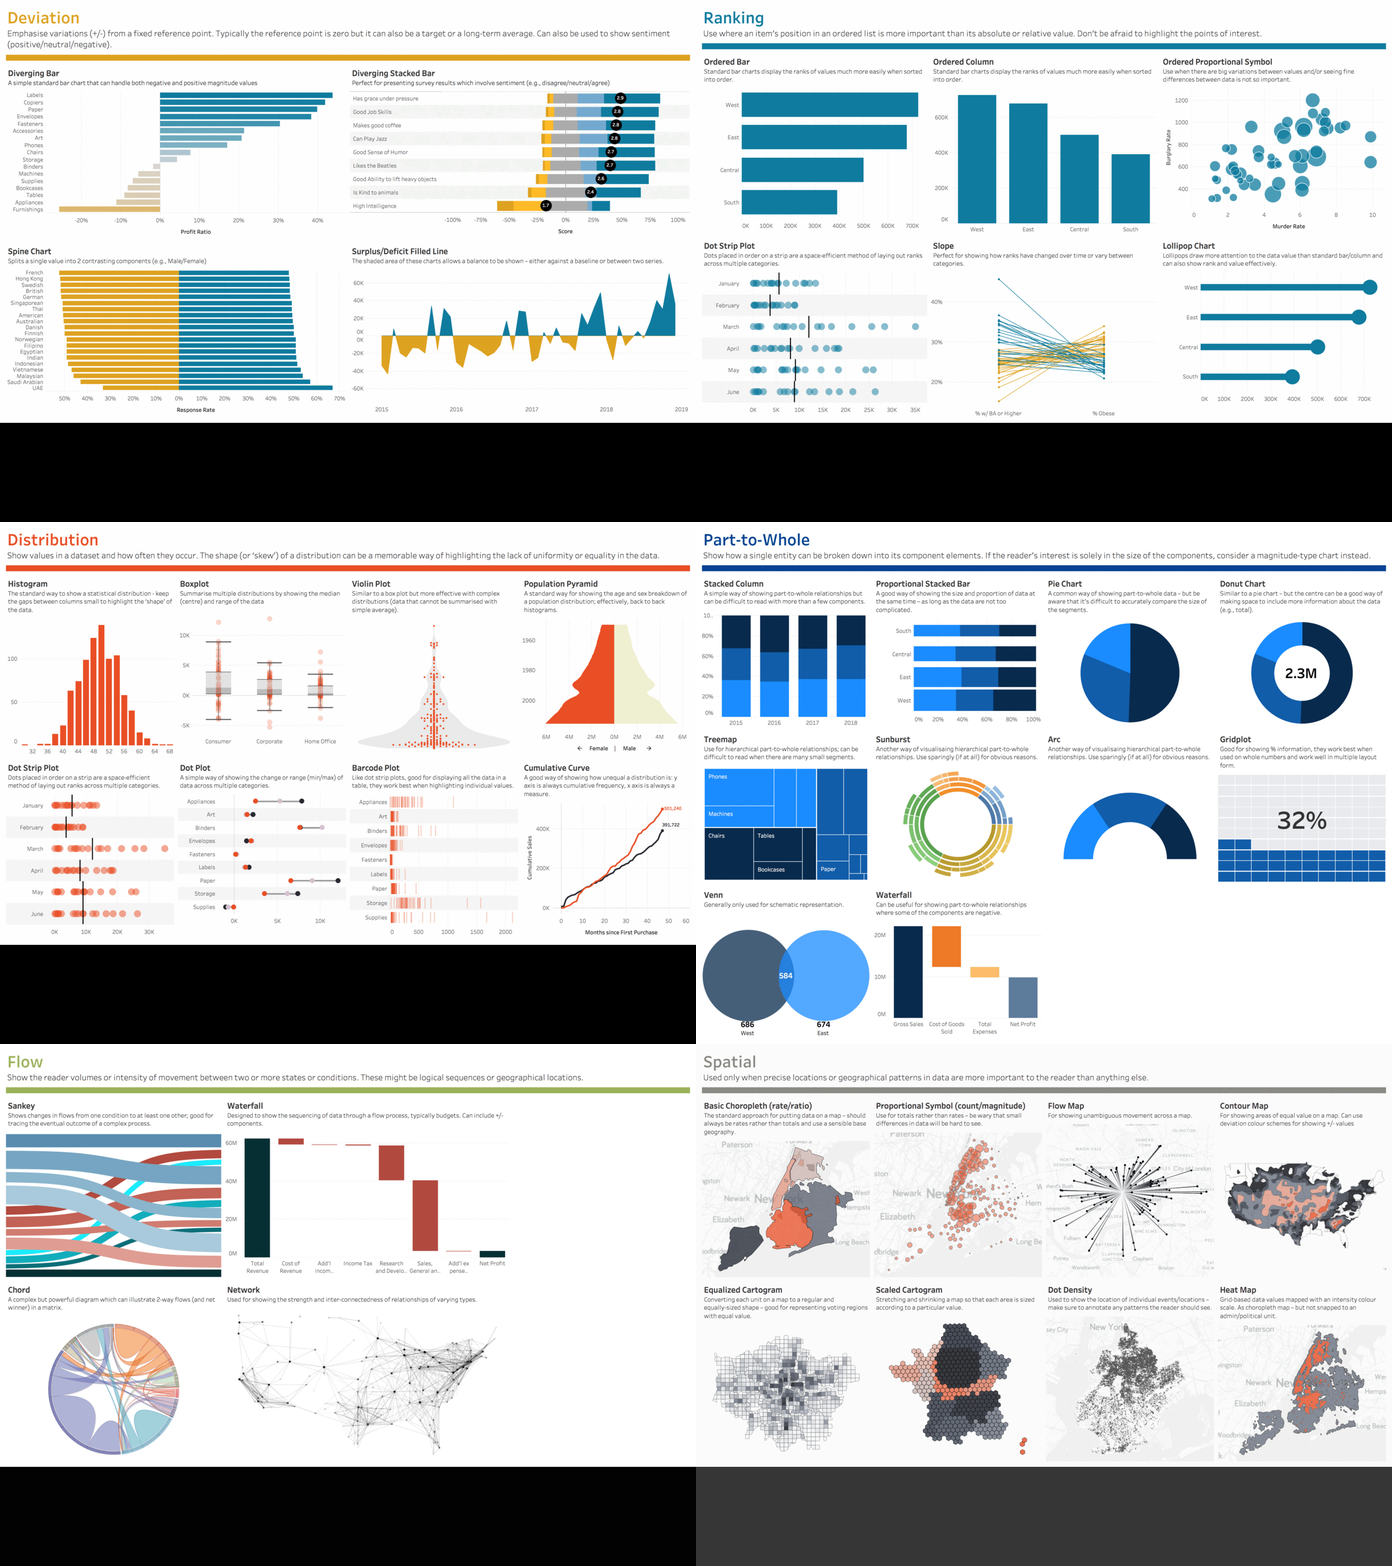
The Financial Times Graphics team created the Visual Vocabulary poster to help all of us make better chart choices. And based on this, Andy Kriebel created the interactive Tableau Edition of the the same.
I was so inspired by it that I decided to create the Power BI Edition, and tried to make it as similar as possible. I also added a few more charts that I thought are relevant. Without further ado, here is the end result.
Direct Link
Note that there are some R/Python visuals and currently, R/Python visuals are not available on “Publish to Web”. Hence, I have just used a checkbox on the top of the report to show the images wherever R visuals are used (can be identified by the colorful border around the image). However, you can download the source file and then publish it to your tenant, and see the actual R visuals there in a browser by unselecting the checkbox. You can also look at the pbix file and see the source code behind the visuals.
Credits
- Andy Kriebel (t | b): Thank you for all that you do for the #dataviz community. I wouldn’t have tried this project if I had not seen your post. Even the design as well as the data for most of the visuals are copied from your Tableau Workbook.
- FT Graphics Team (link): Alan Smith; Chris Campbell; Ian Bott; Liz Faunce; Graham Parrish; Billy Ehrenberg; Paul McCallum; Martin Stabe
- Power BI & Tableau Community: for sharing all your amazing #dataviz techniques. The tools might be different, but the techniques that you learn in one tool can easily be applied in others. E.g. – creating cartograms in Power BI became all the more simpler because of the Tableau community blogging about using Alteryx to generate the shapefiles. And a huge thanks to the creators of the Power BI Custom visuals – this project would not be possible if it wasn’t for all your effort in creating and sharing those custom visuals.
- Konstantinos Ioannou (t): for opening up my mind regarding the potential of R/Python visuals as well as creating most of the R visuals in this project.
- David Eldersveld (t | b) - for being my sounding board
- Nujcharee (t) - for creating Violin Plot visual using R for me and kickstarting my R visuals journey
- Pragmatic Works (b) - for blogging about all those amazing custom visuals in Power BI
Source File
You can download the source file from here. Note that you will have to get your own MapBox tokens to view some of the maps in the Spatial section. More info on the same here.
Tutorials
This section will be updated with links on how I created those charts (if I can drag my lazy ass back to this once more!).


Awesome stuff - Thanks a million! is there any way I can get my hands on the underlying data files?
Hi Hitesh, the data is all embedded within the pbix file. So you can still go ahead and refresh (though there will be no change to the data), if that is what you were asking. If you were asking for the shapefiles for some of the map visuals, I will pass them when I create a post on that individual chart. Meanwhile, feel free to email me if you wanted something specifically.
Great work! thanks for the file.
Really helpful, especially for a lateral entrant to finance like me. Thank you!!
…and happy to see, that we share the same kind of “love” 🙂
Really an Intuitive & Great stuff !!
Curious to know whether Power BI is capable of consuming d3 visual types for Maps ?
I am trying to consume a d3 Map (Symbol Map) similar to Flow Map but very pleasing. But, I just cant move further as Power BI not works with javascript code directly in the d3 control file ?
Any leads or help on this please ?
Feel free to reach to me at [email protected] & +91 9620918899
Thanks,
Kaviraj Sekar
Hi Kaviraj,
Have you seen the D3.js custom visual for Power BI? - https://azurebi-docs.jppp.org/powerbi-visuals/d3js.html?tabs=docs%2Cdocs-open
Maybe that might help. Unfortunately, I am not an expert in that visual, but if you do end up making your symbol, please let me know too 🙂
Great work Jason !
Q: The Bump visual on page 4. Where did you get that ?
I created that using Charticulator. Will try to blog about that as a follow up 🙂
This is fantastic! Thanks so much for making this available.
Just as a heads-up, I’ve been working on a violin plot custom visual which has just been approved through the marketplace yesterday. This is in its early days and doesn’t have a subplot like your example but might help those not wishing to use R in their reports.
Great addition :)…
Simply amazing. Nice job man! Very impressive.
Great and nice work!
Thank you very much for the share ?
superb work man, absolutely love it…so many things I can learn form here - thanks for sharing!
- Fadiel Ras
thanks! It’s so helpful!
An excellent piece of work and extremely informative. Many thanks for sharing.
This is a superb work Jason! Thanks for showing to the world of how we can achieve this with Power BI.
This is a really awesome, really helpful post - thank you, we’ll use it happily to train colleagues on different visualizations and when to use them.
Fantastic job, thanks for share with us.
Wonderful job!– Thanks a million!
Can you send me *.pbix file to my email? I could not get this file from dirver.google.com.
Well done!, thanks!
Hi, how do I get the code for Barcode plot in Distribution page. Appreciate if you can email to me.
Thanks!
Great stuff!
Random question…would you happen to have the tableau workbook file as well? I’d love to be able to resort to either if needed and can’t seem to download the workbook from the official website anymore.
Thanks!
J
I am unable to download pbix file